STOCKINTELLECTUAI

The market playbook

The Seven-Stage Market Cycle

The seven steps of a manufactured momentum run — and how to recognize them.

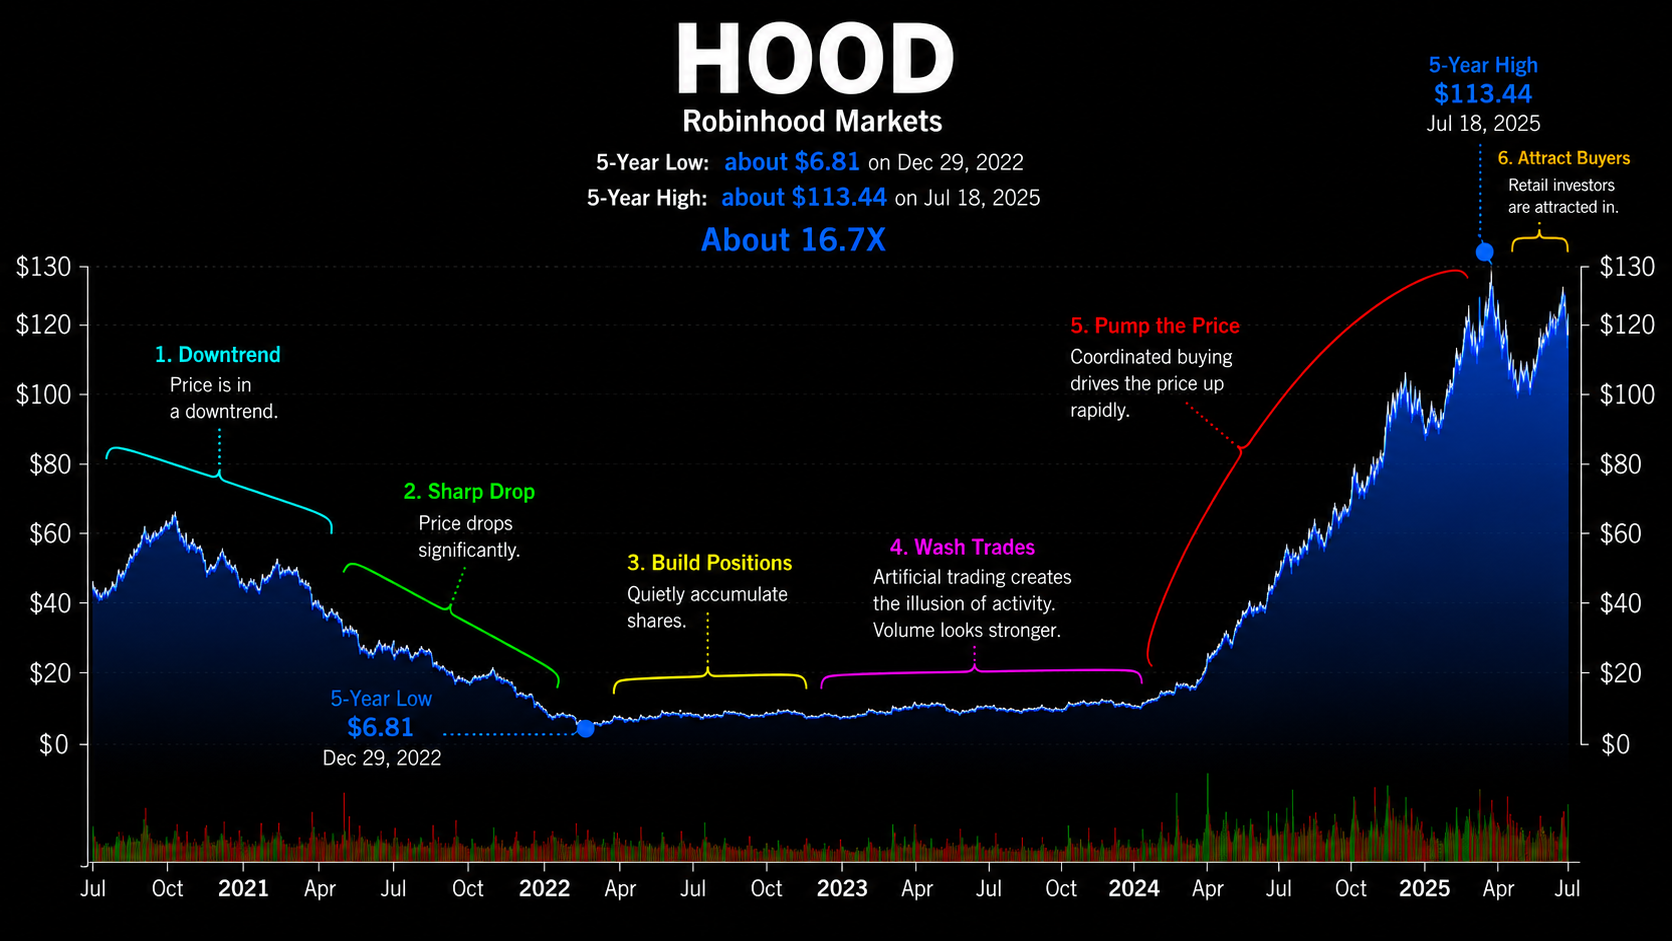
Many big momentum moves follow the same script: fear is manufactured, shares are quietly accumulated, activity is faked, price is pumped, latecomers are lured in, and the whole thing is sold into their demand. The chart below maps those seven steps.

The point isn't to run this playbook — parts of it (like wash trading) are outright illegal. It's to recognize which stage a stock may be in, so you don't end up as the exit liquidity at the top.
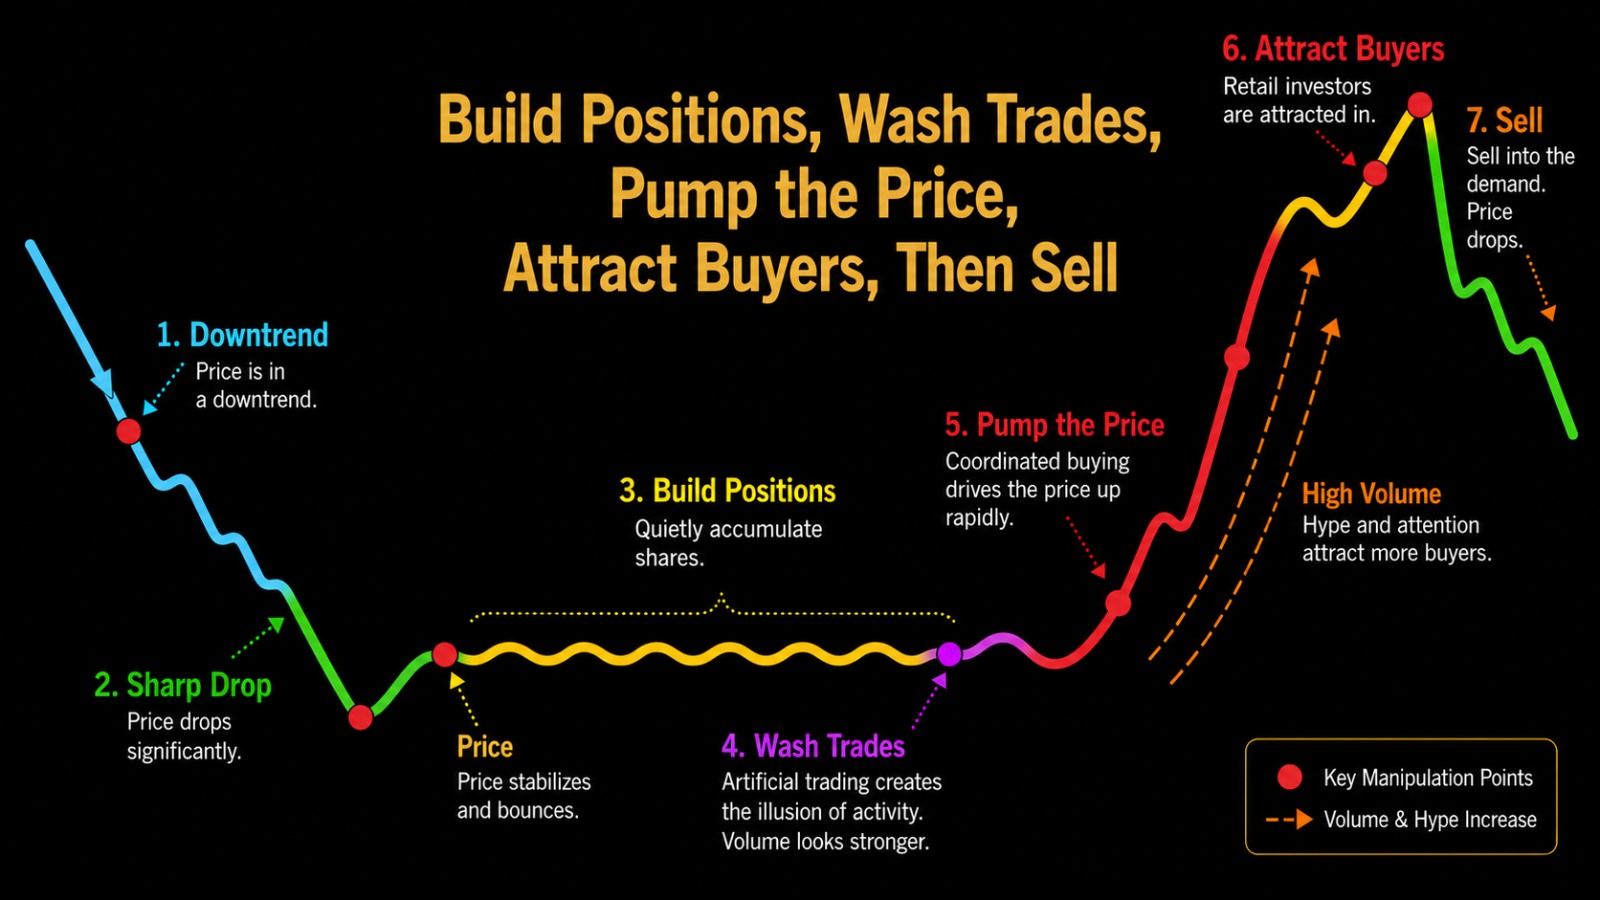
Seven-step manipulation cycle: downtrend, sharp drop, build positions, wash trades, pump the price, attract buyers, then sell into demand.
The seven steps at a glance — each dot maps to a stage below

Stage 1 · Downtrend

The setup begins with a stock stuck in a sustained downtrend. Week after week it grinds lower, coverage turns negative, and holders slowly lose conviction.

The steady decline does quiet work: the longer it lasts, the more tired sellers it produces and the cheaper the supply becomes. Bearish narratives dominate, and confidence deteriorates.

Stage 2 · Sharp Drop

Then comes a final, accelerated leg down — capitulation. Price drops significantly and quickly.

Stop-loss orders trigger, leveraged holders face margin calls, and the last impatient sellers give up near the lows. Fear peaks, and a large slice of the float changes hands cheaply — exactly when informed buyers want it.

Stage 3 · Build Positions

With sellers exhausted, price stabilizes and bounces. This is quiet accumulation: larger players patiently absorb shares inside a relatively narrow range instead of chasing price higher.

It looks dull and uneventful to the public — but beneath the surface, ownership is shifting from emotional sellers to patient hands. Constructive chart bases quietly form here: higher lows and tightening ranges.

Stage 4 · Wash Trades

To make the stock look alive, artificial trading creates the illusion of activity. Coordinated back-and-forth trades inflate volume without any real change of ownership.

Suddenly the name is “in play”: volume looks stronger, scanners flag it, and traders who ignored it start paying attention. (Wash trading is illegal market manipulation — this is a stage to recognize, not to run.)

Stage 5 · Pump the Price

Now the real markup begins. Coordinated buying drives the price up rapidly, often paired with promotion and a positive spin on the story.

Technical breakouts pull in momentum algorithms and trend-following funds. Short sellers rush to cover, adding still more buying pressure to an already rising market.

Stage 6 · Attract Buyers

Rising price plus high volume is the bait. Hype and media attention draw retail investors in — many convinced the move will continue indefinitely and afraid of missing out.

Attention and volume peak here. This surge of eager demand is exactly what the early accumulators have been waiting for.

Stage 7 · Sell

Finally, the operators sell into the demand. Early buyers quietly distribute their shares into the aggressive, euphoric buying at the top.

Once their selling outweighs fresh demand, price rolls over and drops — leaving late entrants holding the decline. Enthusiasm fades, and the cycle eventually resets to begin again.
Real-world examples

The same seven-step shape shows up again and again. Here are recent runs — best-known names first.

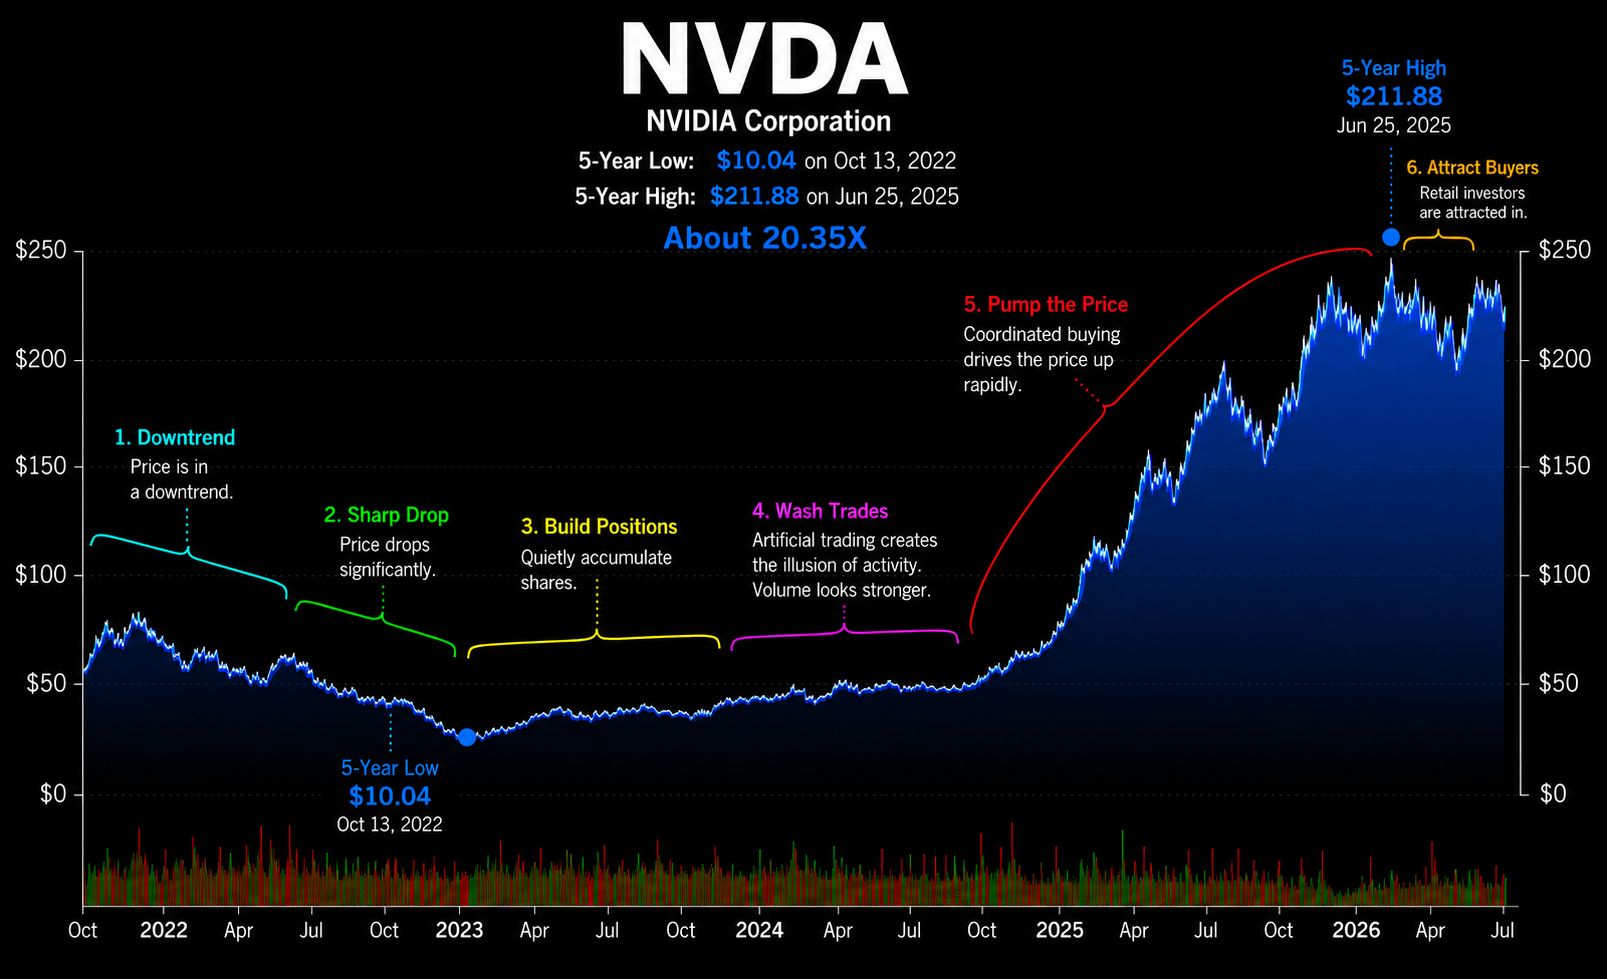
Nvidia (NVDA) price chart showing a pump-and-dump shape
NVDA · Nvidia
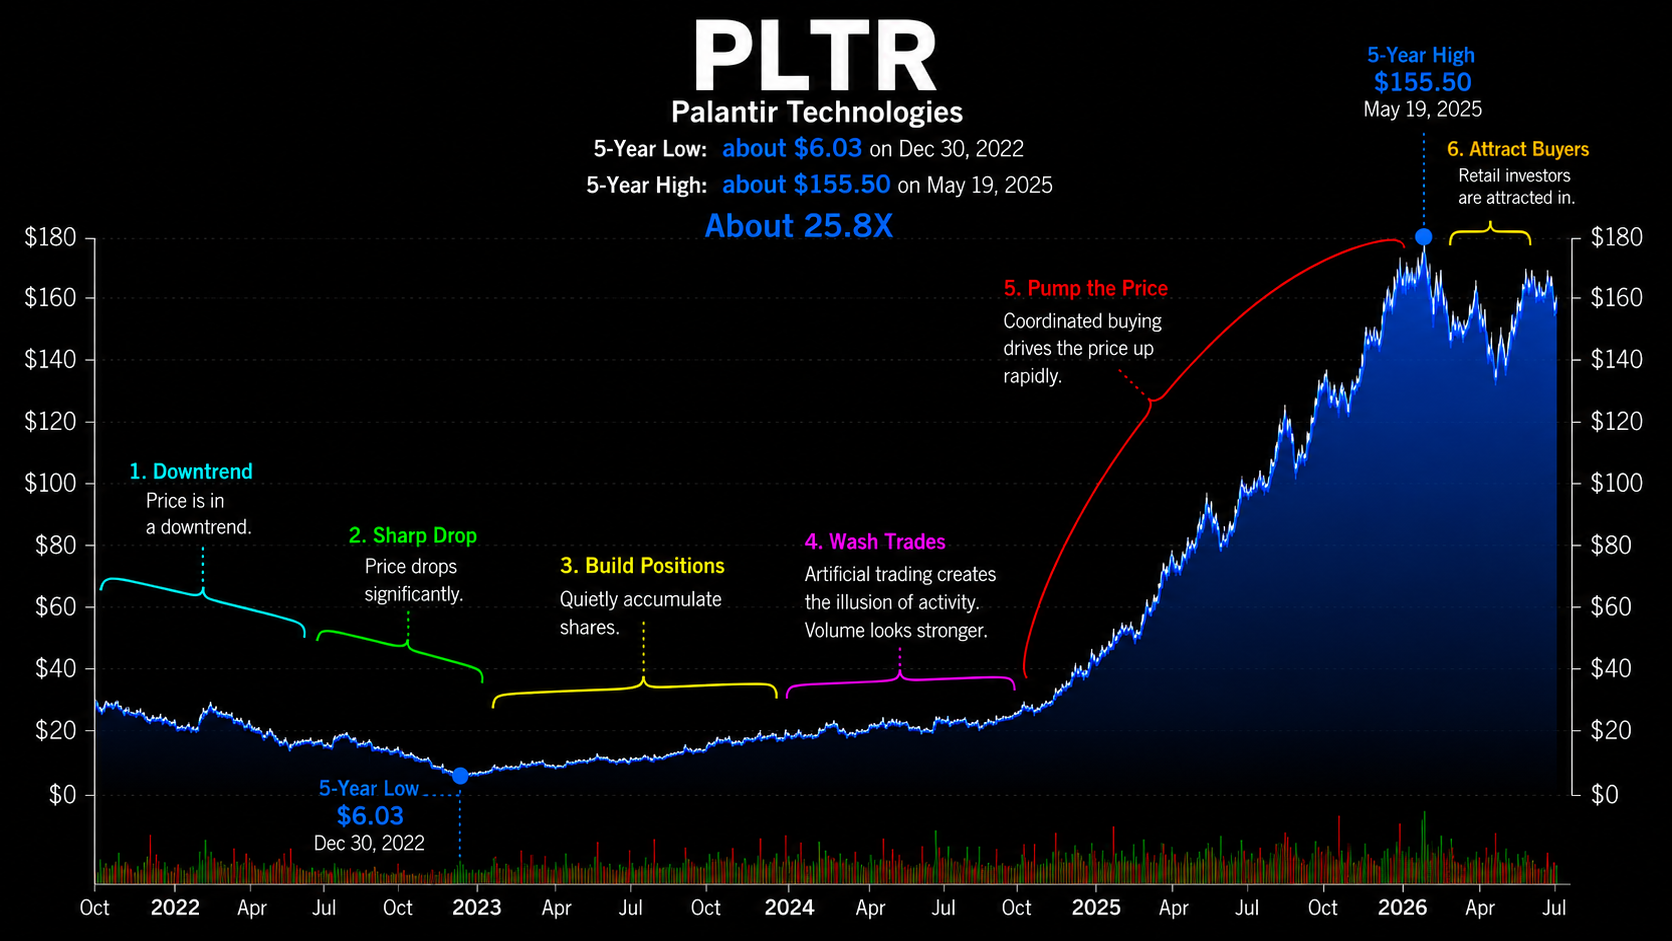
Palantir (PLTR) price chart showing a pump-and-dump shape
PLTR · Palantir
Robinhood (HOOD) price chart showing a pump-and-dump shape
HOOD · Robinhood
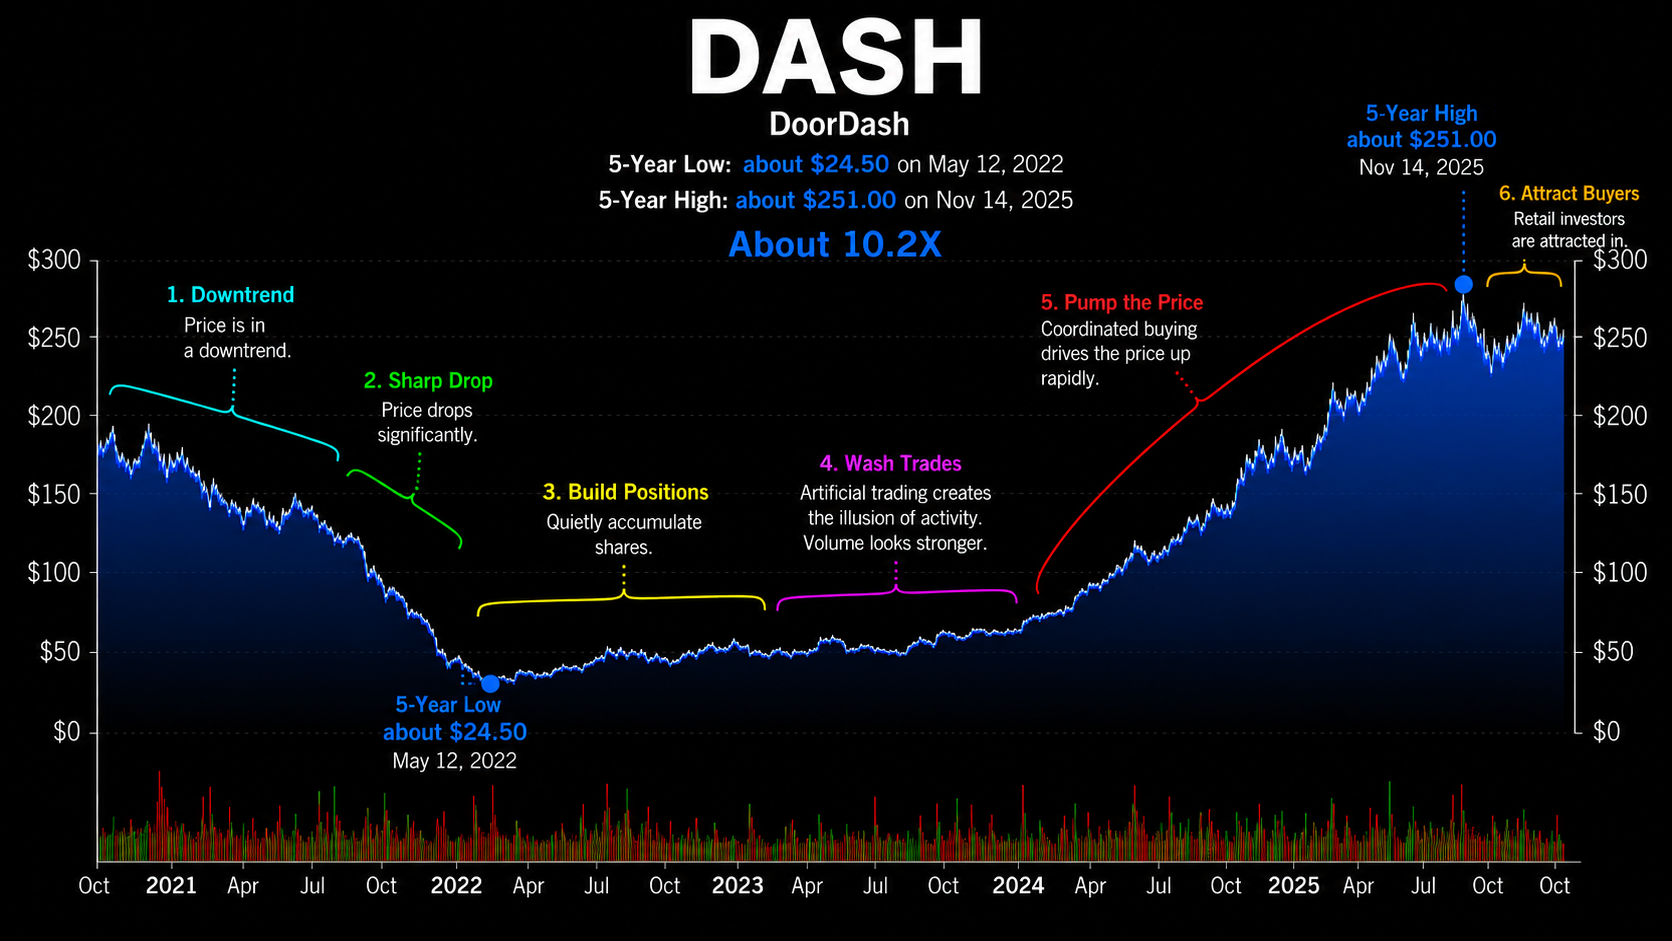
DoorDash (DASH) price chart showing a pump-and-dump shape
DASH · DoorDash
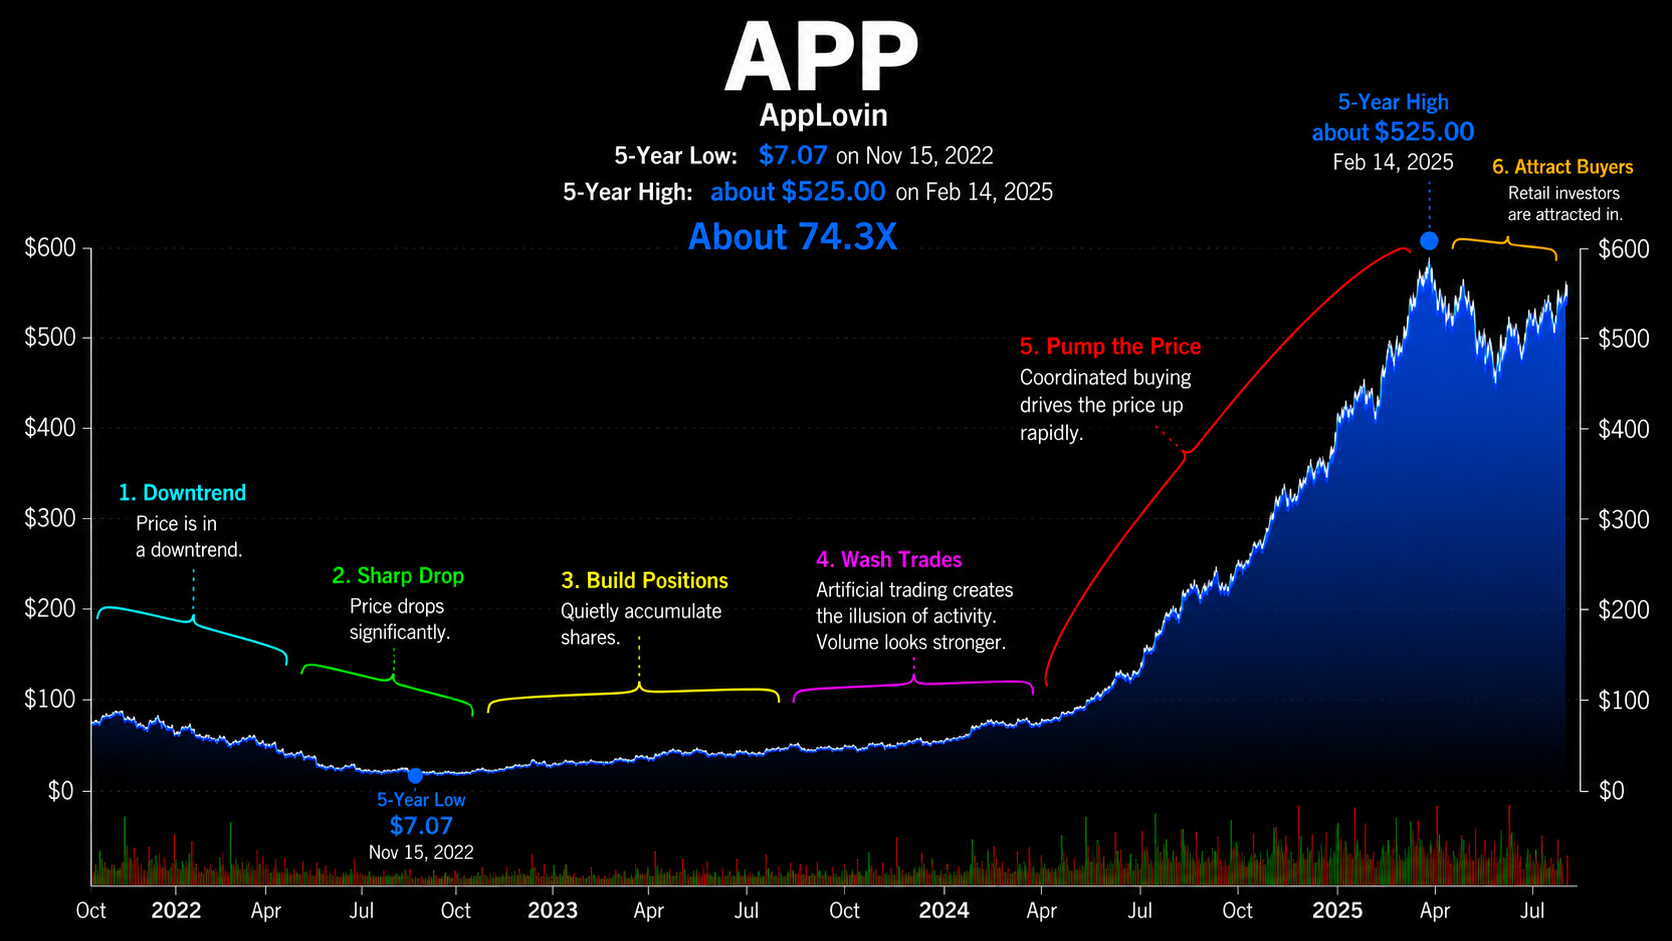
AppLovin (APP) price chart showing a pump-and-dump shape
APP · AppLovin
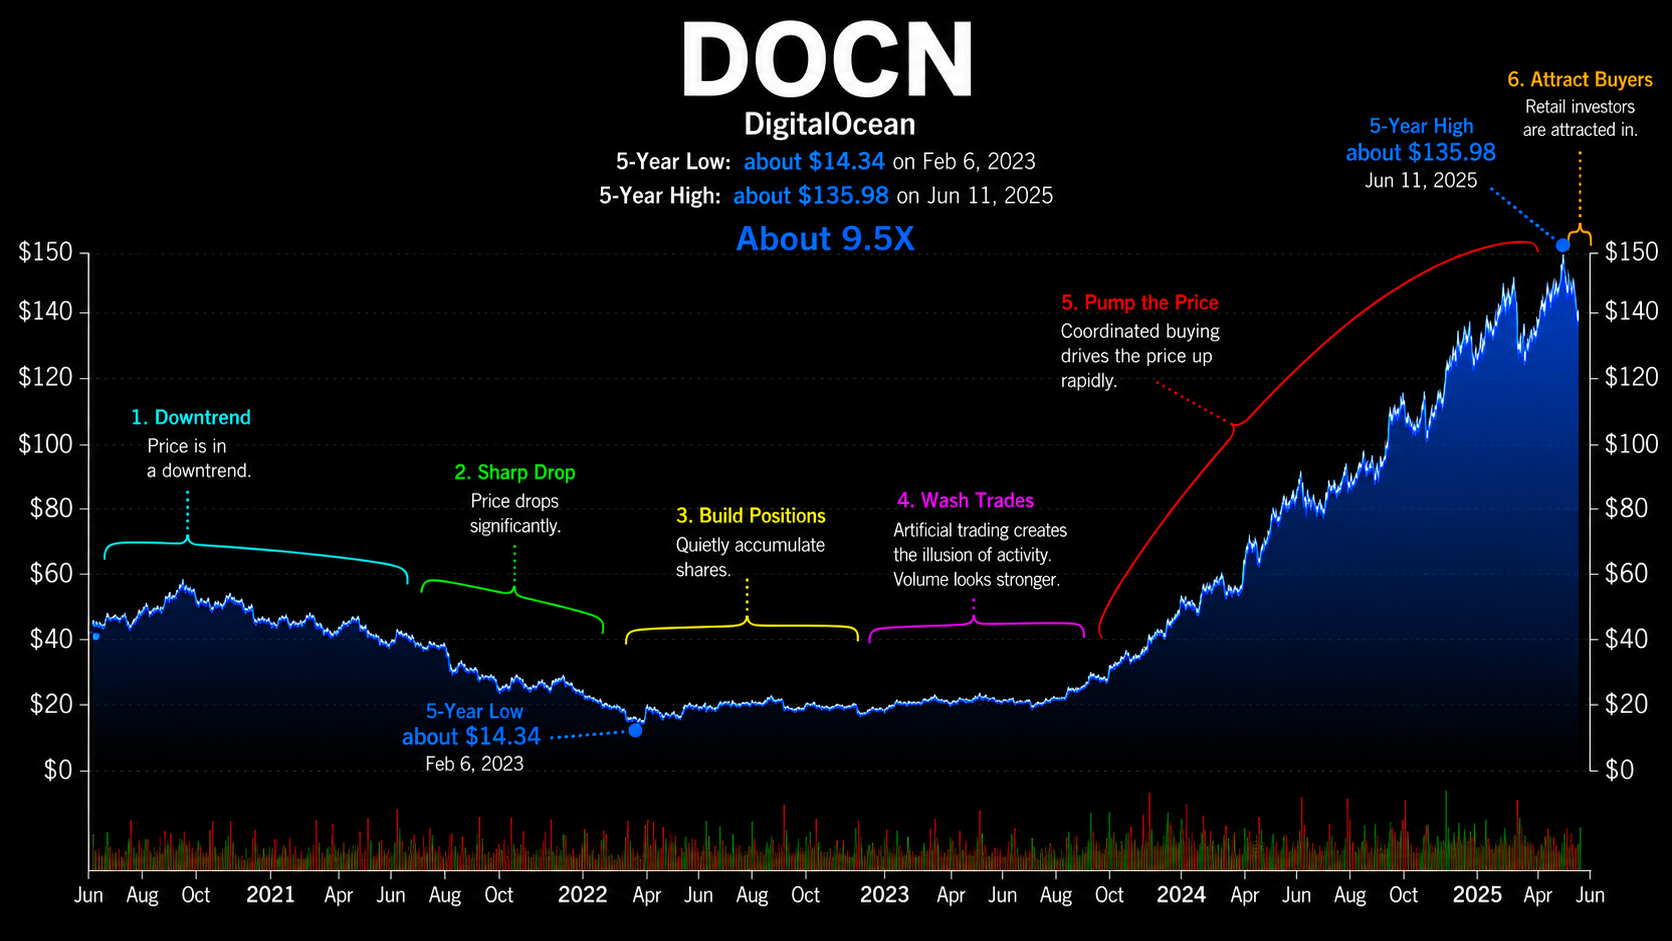
DigitalOcean (DOCN) price chart showing a pump-and-dump shape
DOCN · DigitalOcean
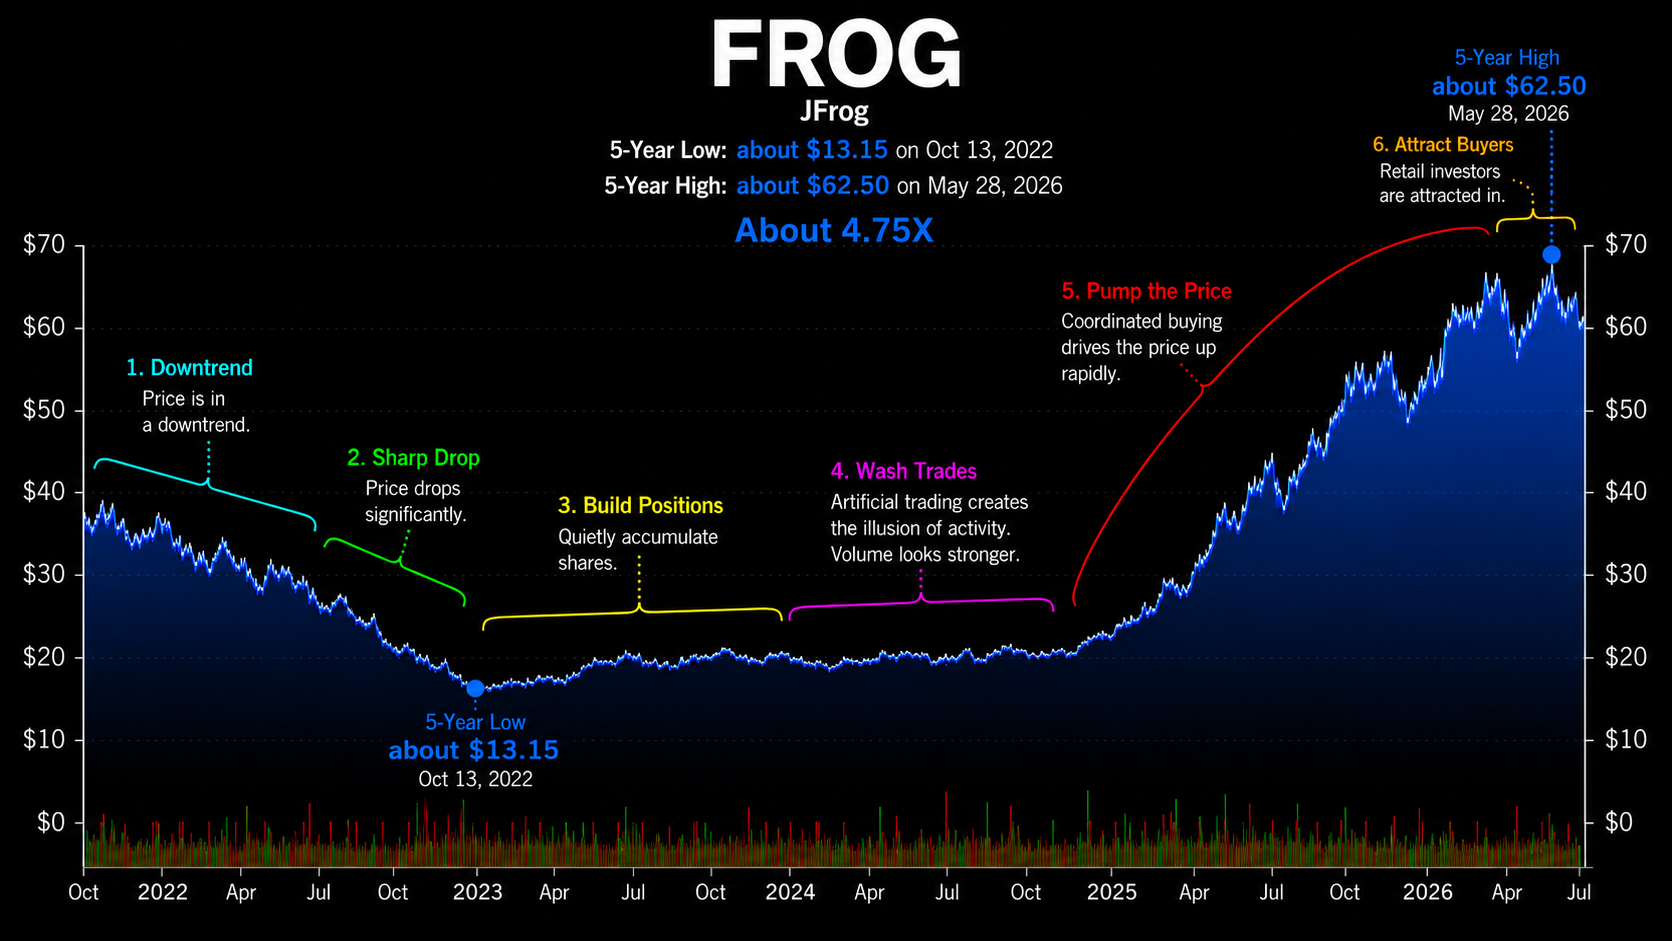
JFrog (FROG) price chart showing a pump-and-dump shape
FROG · JFrog
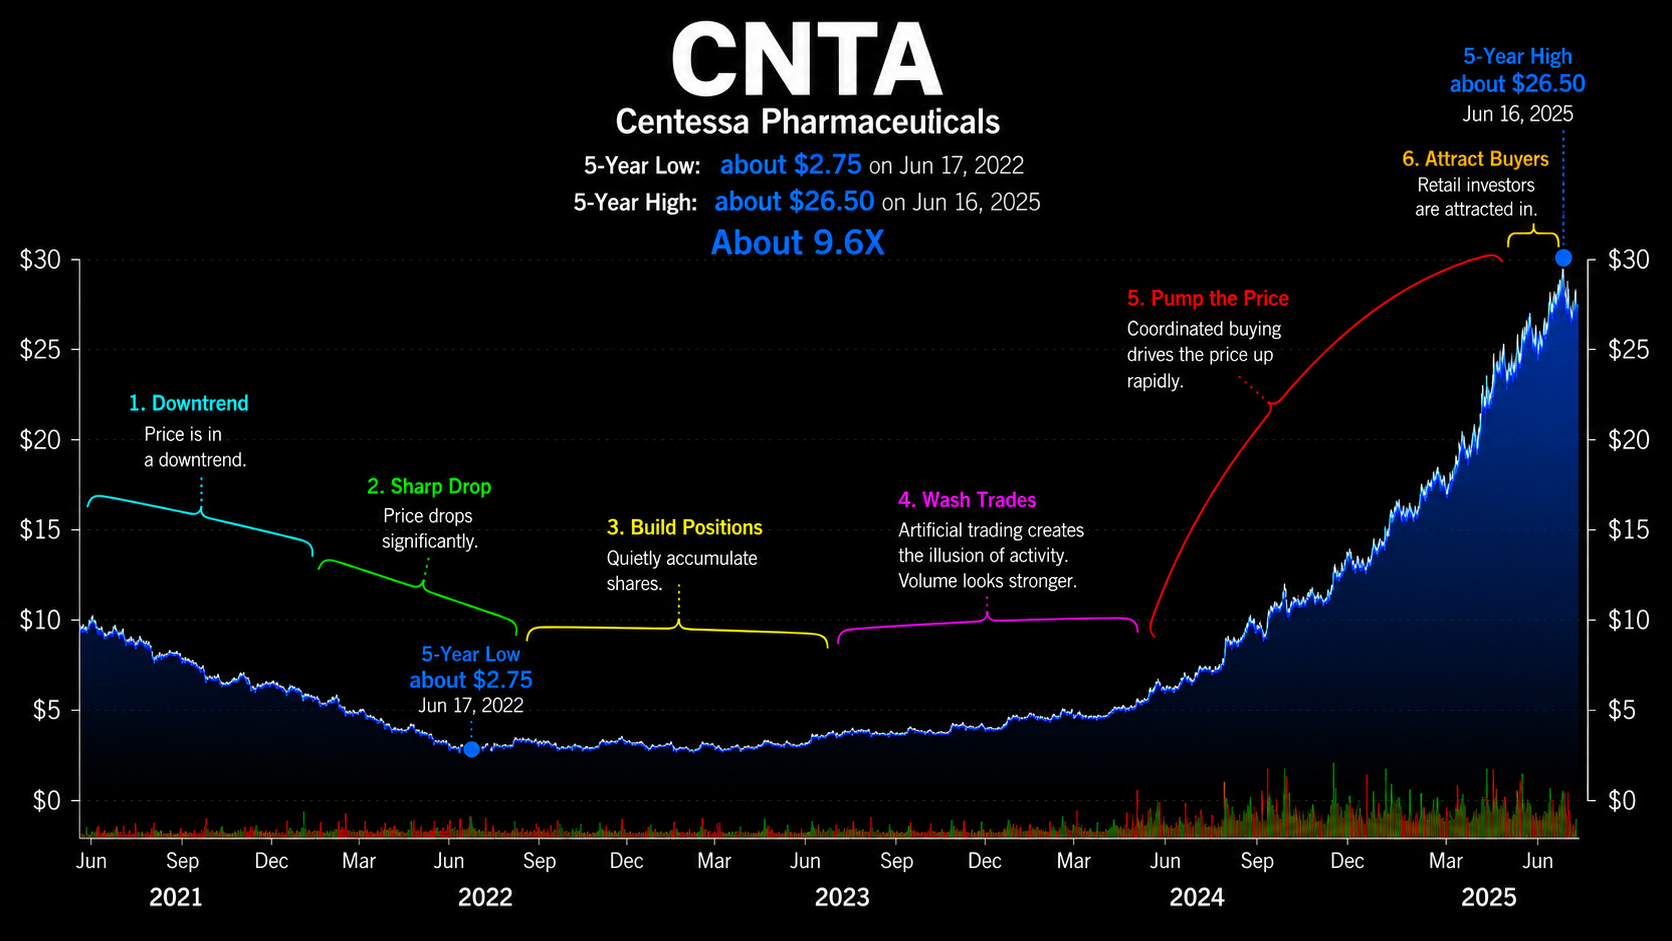
Centessa Pharmaceuticals (CNTA) price chart showing a pump-and-dump shape
CNTA · Centessa Pharmaceuticals

Charts are historical illustrations, not a claim of manipulation in any specific name.

The Bigger Picture

Not every rally is manufactured, and most price moves arise from legitimate factors — earnings, positioning, and genuine changes in sentiment. But the emotional arc is remarkably consistent: fear at the bottom, disbelief through accumulation, then greed and complacency at the top.

For investors, recognizing where a stock may sit in this cycle can be as valuable as reading its financials. The best opportunities tend to appear when sentiment is at its worst; the biggest risks show up when optimism becomes universal.

Team, Research & Product

Our team brings extensive experience in investment research, quantitative analysis, software development, and U.S. market analysis. By combining AI-driven modeling with comprehensive analysis across a wide range of data sources, we seek to identify stocks moving through Stage 4 and entering the early phase of Stage 5, where stronger upward momentum may begin to develop.

Based on their business fundamentals, growth characteristics, market position, and long-term upside potential, selected stocks are classified into three research classes.

Research Classifications & Pricing

Our research is offered through three one-time purchase options, allowing users to choose the level of analysis that best suits their interests and research needs.

  • Class C

    $49

    This category of stocks, based on our AI model, has the potential to appreciate by 3× or more from its past five-year low, with such gains typically occurring over a three-to-four-year period. FROG serves as a Class C example: the stock reached a low of $13.15 in October 2022 and rose to $62.50 by May 2026 — a 4.75× increase over 3 years and 7 months.

    Get Class C →
  • Class B

    $799

    This category of stocks, based on our AI model, has the potential to appreciate by 5× or more from its past five-year low, with such gains typically occurring over a three-to-four-year period. DASH serves as a Class B example: the stock reached a low of $24.50 in May 2022 and rose to $251 by November 2025 — a 10.2× increase over 3 years and 6 months.

    Get Class B →
  • Class A

    $2499

    This category of stocks, based on our AI model, has the potential to appreciate by 10× or more from its past five-year low, with such gains typically occurring over a three-to-four-year period. NVDA serves as an example: the stock reached a low of $10.04 in October 2022 and rose to $211.88 by June 2025 — a 20.35× increase over 2 years and 8 months.

    Get Class A →

All pricing is charged as a one-time purchase. Classifications and potential return ranges are provided for informational and research purposes only. They are based on assumptions, historical patterns, and model-generated analysis, all of which are subject to uncertainty and change.

Educational · not investment advice